


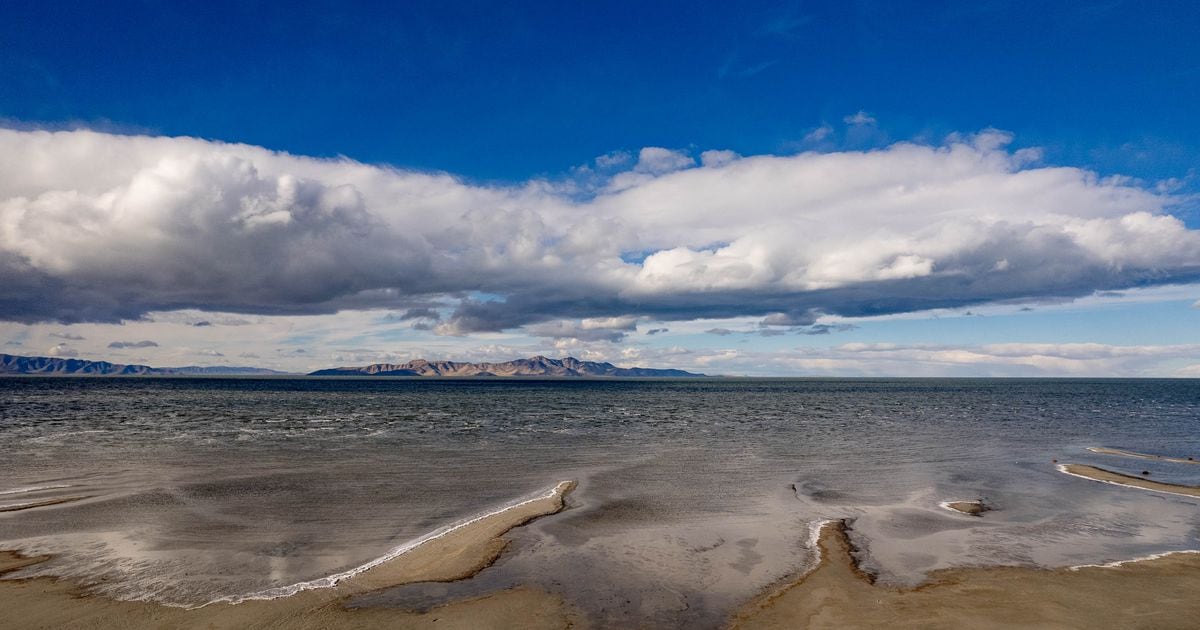

A puddle of its former self, the Great Salt Lake is rimmed by vast reaches of exposed lake bed.
The lake’s size fluctuates naturally with seasonal and long-term weather patterns, but the lake has been experiencing decline for decades as Utahns take water out of rivers and streams that once fed the Great Salt Lake for use in homes, farms and industries.
A time lapse of satellite images of the lake shows it pulling back, turning Antelope Island into a peninsula and Farmington Bay into a dust pit.
(Interactive from Google Earth Engine) The above time lapse shows changes to Utah’s Great Salt Lake between 1984 and 2022. Press play or select a year to see how the lake has shrunk over the past 32 years.
The Department of Natural Resources has developed an elevation matrix for the Great Salt Lake identifying its healthy range — when islands are islands again, salinity levels help brine shrimp and brine flies thrive, bird habitat is abundant — but the water is not so high that it causes the flooding and havoc seen in the 1980s. That sweet spot lies between 4,198 and 4,205 feet above sea level.
The last time the lake reached an average annual elevation above 4,198 feet was 2002 — the same year Salt Lake City last hosted the Winter Games. The lake came close to the healthy range in 2012, but didn’t quite make it over 4,198.
As of June 12, the south half of the Great Salt Lake sits at 4,194.9 feet and the north half is at 4,192.1 feet.
A rock-filled railroad causeway bisecting the lake restricts water from flowing north, which means the elevations in the two halves sometimes vary.
State resource managers filled in a breach through that causeway in 2022 to stave off rising salinity levels in the fresher southern half, which has made those elevation differences much more pronounced.
They won’t raise the breach again unless the south arm of the lake drops to 4,190 feet.
The causeway has likely kept the over-tapped lake viable for decades, allowing multimillion-dollar lake-based industries and massive flocks of migrating birds to thrive.
It also means the north and south arms of the lake have different salinity levels and are different colors.
Megan Banta is The Salt Lake Tribune’s data enterprise reporter, a philanthropically supported position. The Tribune retains control over all editorial decisions.


